
UNCTAD.org 23 April 2025
Maritime transport moves over 80% of goods traded worldwide. Country-level seaborne trade data is vital for shaping better transport, trade and investment policies.
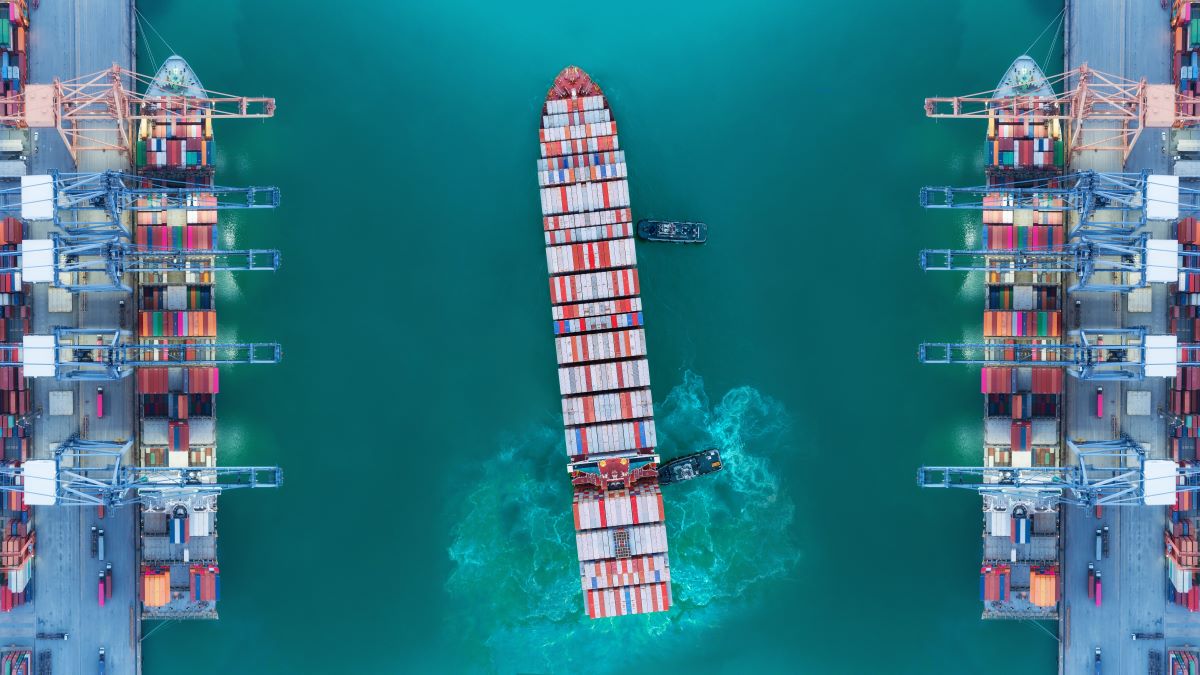
UN Trade and Development (UNCTAD) released on 15 April new seaborne trade data. For the first time, the dataset includes country-level statistics.
Maritime transport is the backbone of global trade, moving over 80% of goods traded worldwide by volume. It connects global value chains, carrying raw materials and semi-processed goods to production hubs and delivering finished products to consumers. These flows are vital for industrialization, economic growth and job creation.
Seaborne trade has evolved over the decades, shaped by containerization, the rise of developing economies and shifting production and consumption patterns. Today, digitalization, geopolitics and the push for sustainability and climate resilience are redefining the sector.
A clearer picture of who ships what – and how much
Reliable, up-to-date country-level data is key to understanding trade flows and guiding better transport and trade policies and investment decisions.
Built from official trade data reported by governments to UN Comtrade, the new dataset offers a more accurate and comparable view of global maritime cargo movements, helping countries to:
- Monitor trade performance and competitiveness.
- Assess integration into global supply chains and trade networks.
- Inform port and transport infrastructure investment decisions.
- Track progress on Sustainable Development Goal 9.1.2 to develop quality, reliable, sustainable and resilient infrastructure – for which maritime freight and port cargo volumes are indicators.
Data highlights developing countries’ rising share of maritime trade
Historically, developing countries served mainly as loading hubs – major exporters of raw materials but marginal importers of manufactured goods. But this has evolved since the 1970s, driven by structural changes such as the oil crises, trade liberalization, increased private sector participation in port operations, the rise of container shipping and reforms to liner shipping alliances.
The shift accelerated in the early 2000s as developing countries increased trade among themselves – including in raw materials, oil and manufactured goods. Their share of global maritime freight rose from 38% in 2000 to 54% in 2023. The surge was led by Asia, with China driving much of the growth.
Read full article here https://unctad.org/news/shipping-data-unctad-releases-new-seaborne-trade-statistics
