
visualcapitalist.com November 15, 2023 By Bruno Venditti
Metals are a big part of our daily lives, found in every building we enter and all devices we use.
Today, major industries that directly consume processed mineral materials contribute 14% of the United States economy.
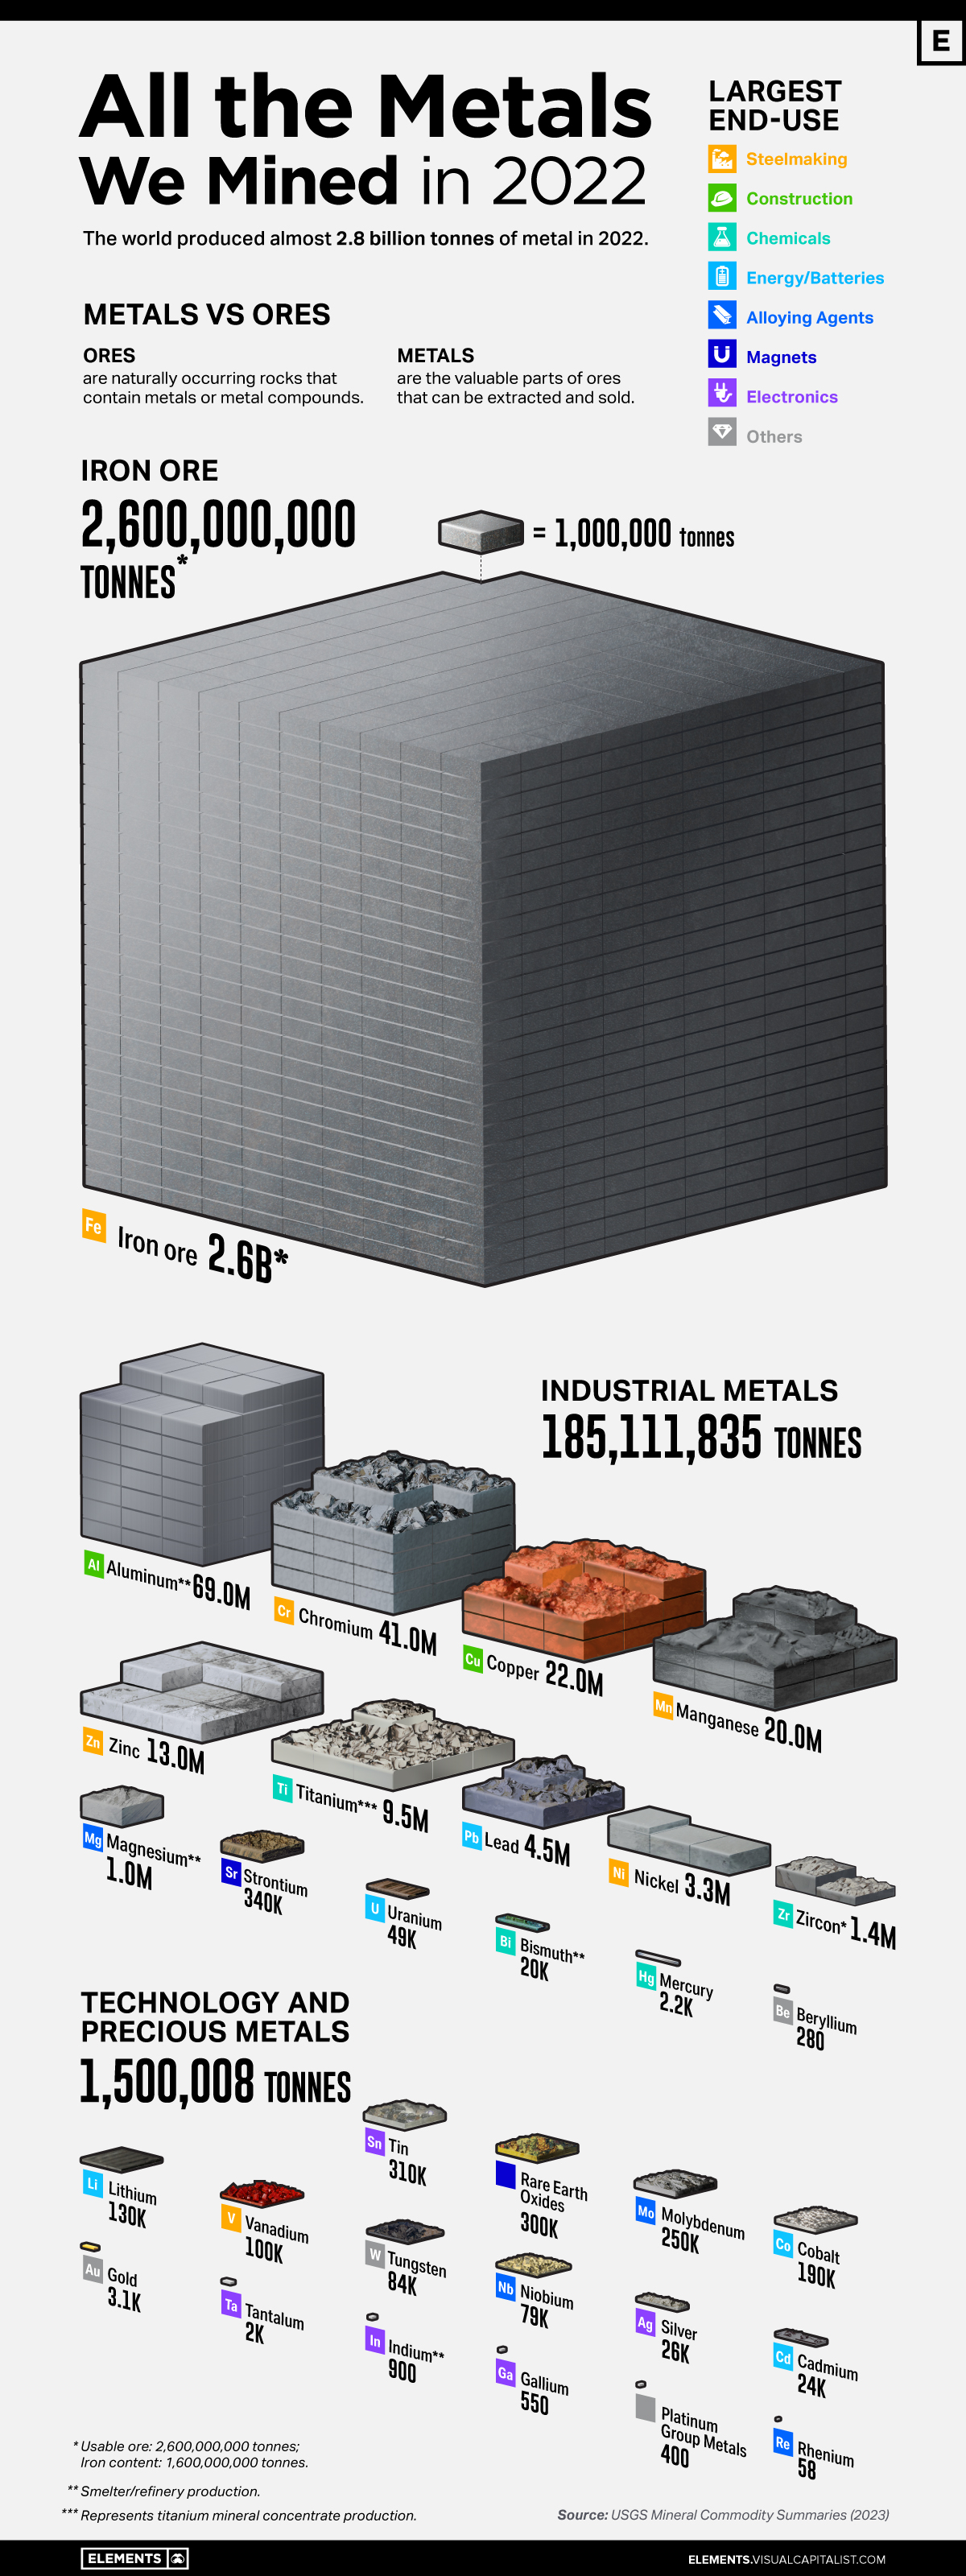
The above infographic visualizes all 2.8 billion tonnes of metals mined in 2022 and highlights each metal’s largest end-use using data from the United States Geological Survey (USGS).
Iron Ore Dominance
Iron ore dominates the metals mining landscape, comprising 93% of the total mined. In 2022, 2.6 billion tonnes of iron ore were mined, containing about 1.6 billion tonnes of iron.
| Metal/Ore | Quantity Mined in 2022 (tonnes) | % of Total |
|---|---|---|
| Iron ore | 2,600,000,000 | 93.3% |
| Industrial metals | 185,111,835 | 6.6% |
| Technology and Precious Metals | 1,500,008 | 0.05% |
| Total | 2,786,611,843 | 100% |
Percentages may not add up to 100 due to rounding.
Iron ores are found in various geologic environments, such as igneous, metamorphic, or sedimentary rocks, and can contain over 70% iron, with many falling in the 50-60% range.
Combined with other materials like coke and limestone, iron ore is primarily used in steel production. Today, almost all (98%) iron ore is dedicated to steelmaking.
The ore is typically mined in about 50 countries, but Australia, Brazil, China, and India are responsible for 75% of the production.
Because of its essential role in infrastructure development, iron ore is one of the most crucial materials underpinning urbanization and economic growth.
Industrial Metals
Industrial metals occupy the second position on our list, constituting 6.6% of all metals mined in 2022. These metals, including copper, aluminum, lead, and zinc, are employed in construction and industrial applications.
Aluminum constituted nearly 40% of industrial metal production in 2022. China was responsible for 56% of all aluminum produced.
| Industrial Metals | 2022 Mine Production (tonnes) | % of Total |
|---|---|---|
| Aluminum | 69,000,000 | 37.3% |
| Chromium | 41,000,000 | 22.1% |
| Copper | 22,000,000 | 11.9% |
| Manganese | 20,000,000 | 10.8% |
| Zinc | 13,000,000 | 7.0% |
| Titanium (mineral concentrates) | 9,500,000 | 5.1% |
| Lead | 4,500,000 | 2.4% |
| Nickel | 3,300,000 | 1.8% |
| Zirconium Minerals (Zircon) | 1,400,000 | 0.8% |
| Magnesium | 1,000,000 | 0.5% |
| Total | 185,111,835 | 100.00% |
In the second position is chromium, which plays a primary role in rendering stainless steel corrosion-resistant. South Africa led chromium production, accounting for 44% of the total mined last year.
Technology and Precious Metals
Despite representing less than 1% of all the metals mined, technology metals have been on the news over the last few years as countries and companies seek these materials to reduce carbon emissions and improve productivity.
| Technology and Precious Metals | 2022 Mine Production (tonnes) | % of Total |
|---|---|---|
| Tin | 310,000 | 20.7% |
| Rare Earth Oxides | 300,000 | 20.0% |
| Molybdenum | 250,000 | 16.7% |
| Cobalt | 190,000 | 12.7% |
| Lithium | 130,000 | 8.7% |
| Vanadium | 100,000 | 6.7% |
| Tungsten | 84,000 | 5.6% |
| Niobium | 79,000 | 5.3% |
| Silver | 26,000 | 1.7% |
| Cadmium | 24,000 | 1.6% |
| Total | 1,500,008 | 100% |
They include lithium and cobalt, used in electric vehicles and battery storage, and rare earths, used in magnets, metal alloys, and electronics. Many of them are considered critical for countries’ security due to their role in clean energy technologies and dependency on other nations to supply domestic demand.
However, despite increasing interest in these metals, they are still behind precious metals such as gold and silver regarding market size.
The gold market, for example, reached $196 billion in 2022, compared to $10.6 billion of the rare earth market.
What are Critical Minerals?
There is no universally accepted definition of critical minerals. Countries and regions maintain lists that mirror current technology requirements and supply and demand dynamics, among other factors.
These lists are also constantly changing. For example, the EU’s first critical minerals list in 2011 featured only 14 raw materials. In contrast, the 2023 version identified 34 raw materials as critical.
One thing countries share, however, is the concern that a lack of minerals could slow down the energy transition.
With most countries committed to reducing greenhouse gas emissions, the total mineral demand from clean energy technologies is expected to double by 2040.
U.S. and EU Seek to Reduce Import Reliance on Critical Minerals
Ten materials feature on critical material lists of both the U.S., the EU, and China, including cobalt, lithium, graphite, and rare earths.
| Mineral / Considered Critical |  U.S. U.S. |  EU EU |  China China |
|---|---|---|---|
| Aluminum/ bauxite | Yes | Yes | Yes |
| Antimony | Yes | Yes | Yes |
| Cobalt | Yes | Yes | Yes |
| Copper | Yes | Yes | Yes |
| Fluorspar | Yes | Yes | Yes |
| Graphite | Yes | Yes | Yes |
| Lithium | Yes | Yes | Yes |
| Nickel | Yes | Yes | Yes |
| Rare earths | Yes | Yes | Yes |
| Tungsten | Yes | Yes | Yes |
Despite having most of the same materials found in the U.S. or China’s list, the European list is the only one to include phosphate rock. The region has limited phosphate resources (only produced in Finland) and largely depends on imports of the material essential for manufacturing fertilizers.
Coking coal is also only on the EU list. The material is used in the manufacture of pig iron and steel. Production is currently dominated by China (58%), followed by Australia (17%), Russia (7%), and the U.S. (7%).
The U.S. has also sought to reduce its reliance on imports. Today, the country is 100% import-dependent on manganese and graphite and 76% on cobalt.
After decades of sourcing materials from other countries, the U.S. local production of raw materials has become extremely limited. For instance, there is only one operating nickel mine (primary) in the country, the Eagle Mine in Michigan. Likewise, the country only hosts one lithium source in Nevada, the Silver Peak Mine.
China’s Dominance
Despite being the world’s biggest carbon polluter, China is the largest producer of most of the world’s critical minerals for the green revolution.
China produces 60% of all rare earth elements used as components in high-technology devices, including smartphones and computers. The country also has a 13% share of the lithium production market. In addition, it refines around 35% of the world’s nickel, 58% of lithium, and 70% of cobalt.
Among some of the unique materials on China’s list is gold. Although gold is used on a smaller scale in technology, China has sought gold for economic and geopolitical factors, mainly to diversify its foreign exchange reserves, which rely heavily on the U.S. dollar.
Analysts estimate China has bought a record 400 tonnes of gold in recent years.
China has also slated uranium as a critical mineral. The Chinese government has stated it intends to become self-sufficient in nuclear power plant capacity and fuel production for those plants.
